PARI
SNACC Protein Access Risk Index · Founder & Developer · Ongoing
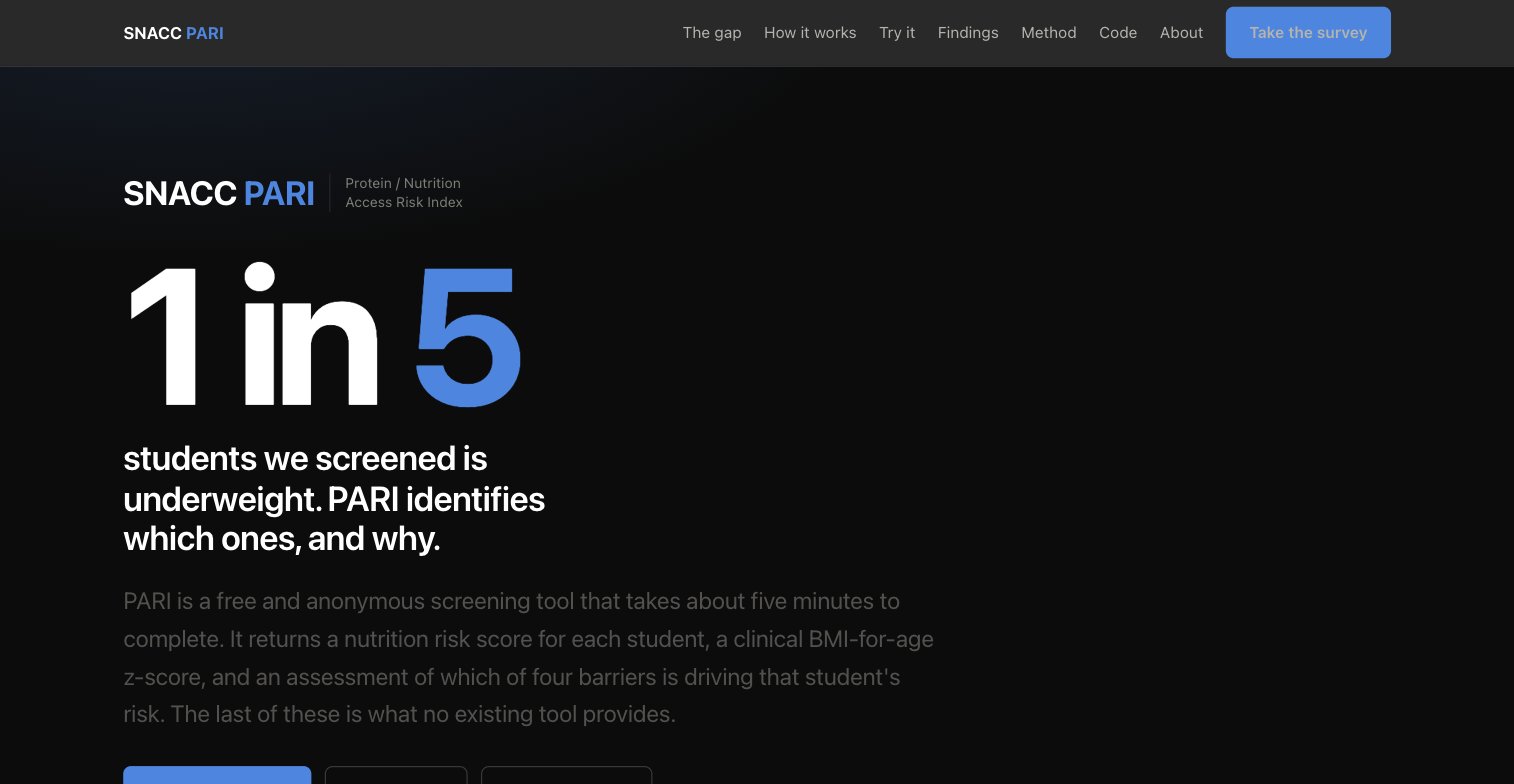
1 in 5 students we screened is underweight. PARI identifies which ones, and why.
PARI is a free and anonymous screening tool for students in Grades 1 to 12. In about five minutes it gives each student a nutrition risk score, a clinical BMI-for-age z-score, and an assessment of which of four barriers is driving that risk. The last of these is what no existing tool provides.
The gap
India has the numbers. No headmaster has theirs.
National surveys describe nutrition in aggregate, but they do not tell a school which of its students are struggling or why. The same underweight child can be the result of four quite different problems, and each needs a different intervention. PARI scores all four.
What students actually eat, across ten food groups, and how often they eat protein-dense foods.
Whether food runs short, how many meals are eaten in a day, and cost barriers.
Whether students know what protein does and what their own needs are.
Whether protein-rich food is sold nearby, and school meal provision.
How it works
Two independent tracks, deliberately kept apart, so that checking one against the other is a genuine test rather than a circular one.
18 survey items: 10 food groups, 3 economic, 3 awareness and 2 structural questions. Scored into a risk score from 0 to 100.
- Low risk≤ 33
- Moderate risk34 to 66
- High risk≥ 67
Height, weight, age and sex, converted with the WHO 2007 LMS reference into a BMI-for-age z-score (BAZ). A BAZ below −2 means underweight.
- Agreement between tracksρ = −0.42
- Screening accuracyAUC 0.72
Students complete the survey anonymously, in about five minutes, in their own language.
The school sees its risk bands and which of the four barriers is driving them.
Each barrier gets its own intervention: meals, food kits, education or access.
Self-generated codes let the same students be screened again to measure change.
What we found
From 1,007 students screened across partner schools.
Underweight rates climb with each risk band, from 7 in 100 low-risk students to 16 in 100 moderate and 30 in 100 high, which is exactly the relationship the score is meant to capture. Awareness is also a real gap: 58% of students could not define protein and 66% did not know their own dietary requirements.
Limitations. Height and weight are self-reported, the data is a single snapshot, the four domains overlap, and benchmarks for younger students are borrowed.
The code
PARI is open source. The instrument, scoring engine, growth-reference tables, anonymised storage layer and codebook are all public.
def _dietary(resp):
    ranks = {g: _FREQ_RANK.get(resp.get(g, "Never"), 0)
             for g, _ in FOOD_GROUPS}

    # Diversity: groups eaten >=3 days/week (rank >= 2)
    diversity = sum(1 for g, _ in FOOD_GROUPS if ranks[g] >= 2)
    if   diversity >= 6: div_pts = 0
    elif diversity >= 4: div_pts = 7
    elif diversity >= 2: div_pts = 14
    else:                div_pts = 20

    # Protein: best weekly frequency among protein-dense groups
    pmax = max(ranks[g] for g in PROTEIN_GROUPS)
    prot_pts = {3: 0, 2: 5, 1: 10, 0: 15}[pmax]

    return div_pts + prot_pts, {...}
The dietary domain. Counts how many food groups a student eats at least three days a week, and how often they eat protein-dense foods. Less variety and less protein add more risk points.
def baz(weight_kg, height_cm, age_years, sex):
    """Return (baz, bmi, category)."""
    b   = bmi(weight_kg, height_cm)
    row = _nearest_row(sex, age_years)
    if b is None or row is None:
        return None, None, None
    _, L, M, S = row
    if L == 0:
        z = math.log(b / M) / S
    else:
        z = (((b / M) ** L) - 1) / (L * S)
    return round(z, 2), round(b, 1), _category(z)
BMI-for-age z-score. Uses the WHO LMS method to convert a student’s BMI into a z-score for their age and sex. A score below −2 means underweight.
Method
Comprehensive National Nutrition Survey. Poorest-quintile odds of stunting, 3.20.
Multi-country study of dietary diversity in adolescents in low- and middle-income countries.
Indian protein requirements, 0.83 to 1.0 g per kg of body weight per day.
BMI-for-age reference for ages 5 to 19, with a cut-off below −2 SD.
Ethics
- No personally identifying data is collected.
- Students use self-generated codes for re-screening.
- Written head-teacher approval is required before deployment.
- Parents can opt out, and results go to schools only in aggregate.
Why it exists
PARI is the measurement layer for feeding programmes: the Free Lunch Programme at KDO Jain School in Hubli, which feeds 300+ students every day, and the Welfare Society for Destitute Children in Mumbai, where 150+ children were screened and 60+ malnutrition cases identified.